Project Overview
Check out this project on Github here
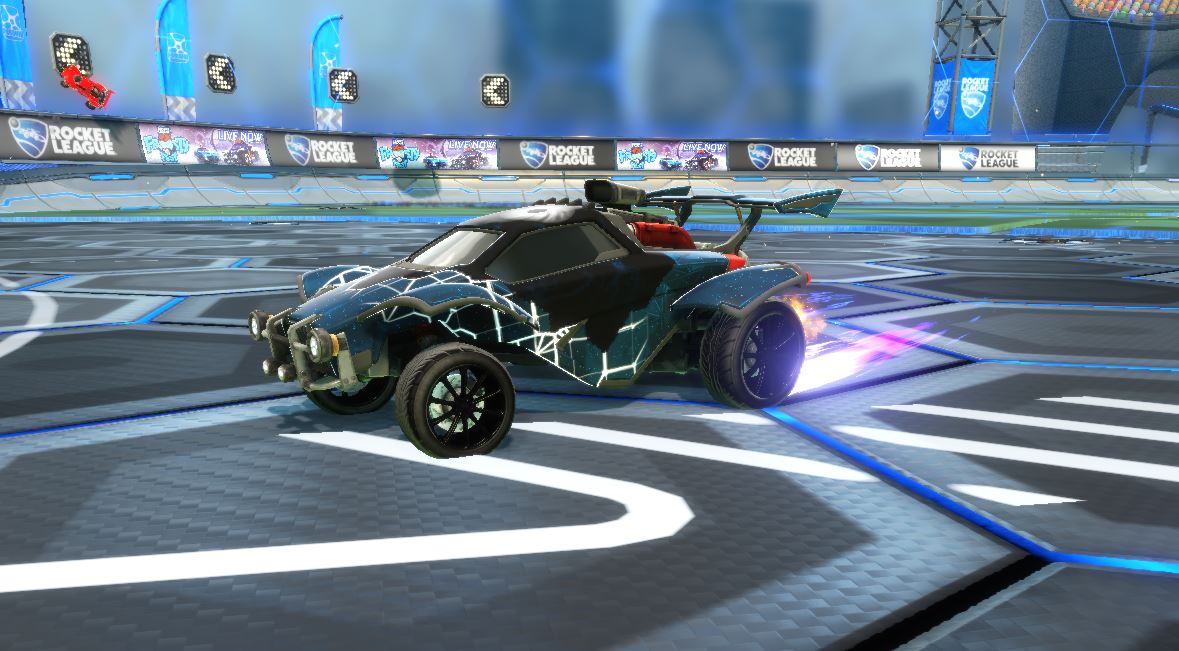
The basis of the project was to make a Bot that would play Rocket League itself, this was coded in Python using the RL Bot GUI API. It is hard coded (Not AI based) and has its own implemented behavioural system to help make smart decisions.
RL BOT GUI
This is a community driven API that is built for multiple languages, RLBot enables custom bots in Rocket League and helps pull game data from a game into readable values.
RLBot uses an API in Rocket League specifically made for us. This API is activated when the game is launched with the ‘-rlbot’ flag, which simultaneously disables all online play. The RLBotCore dll communicates with the game through this API and this is where most of the magic happens. Communication with bots are done through sockets (shared memory in the past) which allow us to support a wide range of languages.
Debug Features
In order to help debug what’s going on while the bot is playing, we setup some draw functions to display specific variables or draw 2D/3D lines in the game.
These are a few examples of functions that are setup to display coordiantes and veloctiy etc.
    self.renderer.draw_string_2d(50, 50, 1, 1,f'Player Co-ords:{car_location}', self.renderer.white())
    self.renderer.draw_string_2d(50, 70, 1, 1, f'Speed: {car_velocity.length():.1f}', self.renderer.white())
    self.renderer.draw_string_2d(50,90, 1, 1, f'Dist. to ball: {distance_to_ball:.1f}', self.renderer.white())
    self.renderer.draw_string_2d(50,110, 1, 1, f'Behaviour: {self.behaviour}', self.renderer.white())
We can also draw 3D lines and shapes on the screen to help show where the car is facing or the direction of specific locations.
    #Draw line to target location and rect on target location
    self.renderer.draw_line_3d(car_location, target_location, self.renderer.white())
    self.renderer.draw_rect_3d(target_location, 8, 8, True, self.renderer.cyan(), centered=True)

    #Draw Goal Locations
    self.renderer.draw_line_3d(car_location, enemy_goal, self.renderer.orange())
    self.renderer.draw_line_3d(car_location, my_goal, self.renderer.blue())
I’m also currently trying to implement a way for the program to be able to draw graphs in Matplotlib to be able to see it’s stats compared to other variables.
